Welcome to Biotoclin
Translating Bioinformatic knowledge into the clinical setting
Analyse your variant
Know our pathogenicity predictors
To assess the functional significance of missense variants, we have developed a set of specific predictors. Predict your variant or check our examples to see the result
BRASS
BRCA Specific Software (BRASS) for the prediction of the functional significance of missense variants in BRCA1 and BRCA2 involved in hereditary breast and ovarian cancer (HBOC)
FHLdb
Database of functional characterization of variants of Familial Hemophagocytic Lymphohistiocytosis
NeoVar
Prediction of the functional significance of missense variants of more than 50 proteins involved in neonatal diseases
ProteinSpecific
Prediction of the functional significance of missense variants in more than 80 proteins involved in diseases with an inheritance component, both common and rare diseases
Fabry
Prediction of the functional significance of missense variants affecting GLA protein involved in Fabry disease, a rare genetic lysosomal storage disease
CADASIL
Prediction of the functional significance of missense variants affecting NOTCH3 protein involved in CADASIL syndrome, the most common form of hereditary stroke disorder
ATMision
Prediction of the functional significance of missense variants affecting ATM protein involved in hereditary breast and ovarian cancer (HBOC)
Disclaimer This resource is uniquely intended for research purposes. The authors are not responsible for neither its use nor misuse. The data provided are not intended as advice of any kind. The authors have worked with care in the development of this server, but assume no liability or responsibility for any error, weakness, incompleteness or temporariness of the resource and of the data provided.
How to interpret a prediction?
Prediction Label
The variants are classified as pathogenic or neutral by a supervised machine learning algorithm
The label depends in the numeric score. Variants above 0.5 are pathogenic while variants low 0.5 are neutral
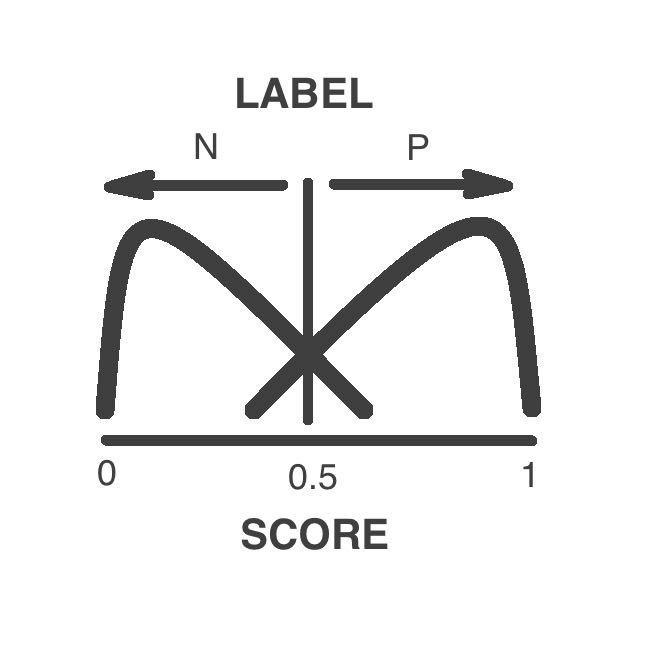
Prediction Score
Beyond the label, a variant is characterized with a numerical score of its pathogenicity. We provide you with this score, so you can have a more precise sense of the consequence of the variant
This score has a continuous range between 0 to 1, being 0 a neutral and 1 a pathogenic variant. The threshold between pathogenic and neutral variant is at 0.5

Prediction Reliability
Such as any other measurement, a predictions has an associated error. This metric measures the accuracy of the prediction
The reliability has a continuous range between 0 to 1, being 1 a trueful prediction
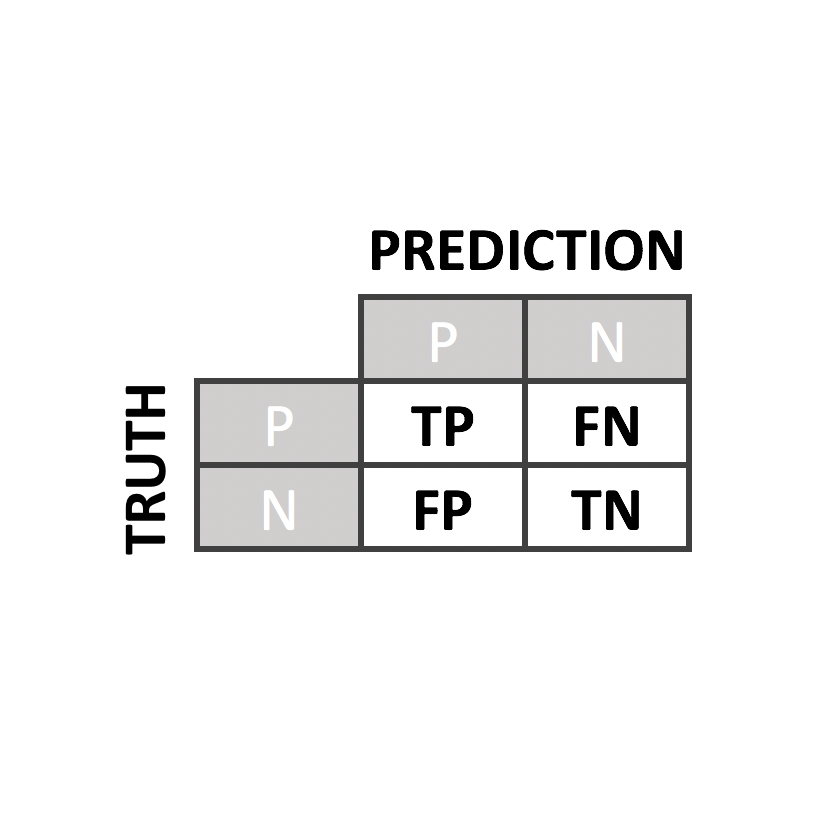
Predictor Performance
We have evaluated our predictors with rigorous quality controls and compared to the state of the art predictors such as PolyPhen2, PON-P2, SIFT or CADD
To evaluate our predictor, we perform a leave-one-out cross-validation. From it, we derived several performance metrics such as sensitivity, specificity, accuracy, AUC and MCC
About us
Supporting Institutions